Seven examples of crowdsourced/home-made technologies generating useful hydrologic information


This article is also available on Youtube/Slide Share

Data is the most important parameter of success in hydrological research. But measuring or collecting hydrologic data is complex due to its inaccessibility and financial requirements. For example, real-time stream level detection can help in the early warning of floods which can prevent/avoid “during” or post-flood disasters. Real-time dataloggers for stream-level detection are available but they are expensive. That is why low-cost alternatives like stream gauges are used. 

    However, the installation of such gauges in every location of a watershed is not possible as many places within a watershed are completely inaccessible. Again, the data collected by stream gauges are not real-time and not readily available to the researchers. One must pay or take permission from the regulating authorities to collect such data. Such requirements delay the project completion time and attract extra expenditures. Therefore, many ungauged or even gauged catchments remain unmonitored or sparsely monitored which in turn makes the flood or storm prediction models erroneous as most of them are data-driven.

    That is why in recent years researchers are utilizing the data generated by the citizen scientist or crowdsourcing platforms which are easy to access and inexpensive. Sometimes technologies that are developed for some other objectives are also being used for monitoring hydrologic parameters due to their low cost and easy accessibility. This article tries to highlight seven such examples where low-cost, but easily accessible devices or crowdsourced data are utilized to monitor hydrologic parameters.


1. Sensors of windshield wipers used as mobile rain gauges


2. Parking Aid Sensors used to measure snow depth


3. Temperature Guns that are used to measure the temperature of a shipment were used for measuring the surface air temperature of the alpine valley


4. Soda bottles as rain gauges for ungauged catchments


5. Sizes of Raindrops were determined by a homemade disdrometer, made of flour on a plate.


6. An app for measuring stream level without any physical installation of stream gauge but by using the citizen science concept of data collection


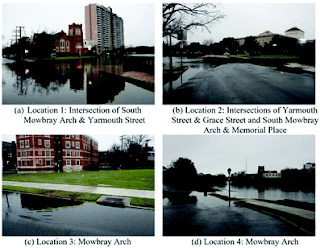
7. Volunteered Geographic Information(VGI)(User/Volunteer generated images of flood inundation) compared by using some technologies of Automatic Flood Detection

Thank you all for reading my blog.
This article is also available on Youtube/Slide Share
@data_hydrology , @Merchandise or @@products_sustainability
Add to Listy

Popular posts from this blog

How to calculate Water Quality Index considering the source type,intended use and climate ?

This WQI's primary innovation is that it calculates the WQI based on the type of source from which water is collected, the WQI's intended use, and the local climate at the time the samples were retrieved. The source or location from where the sample is collected has an impact on the quality of water which the index must incorporate at the time of calculation. The purpose for which the water quality index is calculated changes the weightage of the importance of the different quality parameters. For example, if WQI is calculated for knowing how drinkable the sample is then the weightage of coliform will increase compared to other parameters as the presence of coliform in the drinking water can not be permitted. The climate of the area from where the water is collected is another criterion to consider at the time of calculating the WQI. Based on the climate also the weightage of water quality parameters will vary. There will be a difference in the weight of importance if the sampl...

Five Most Extreme Hydrologic Events that changed the World

Typhoon Tip, Philipines(Collected from : CSMonitor ) Devastating storms, severe flood, acute famine conditions, etc. hydrological events of extreme nature has changed human history. Any event which is not normal is known as an abnormal event. In the case of hydrology, an event that has a return period of more than 100 years is considered Extreme. According to Herring(2020) of Climate.gov, "An extreme event is a time and place in which weather, climate, or environmental conditions—such as temperature, precipitation, drought, or flooding—rank above a threshold value near the upper or lower ends of the range of historical measurements." Though the threshold is not objective, few researchers have defined "extreme events as those that occur in the highest or lowest 5% or 10% of historical measurements". Some have described events by their deviation from the mean, or by their occurrence interval.   Here the most severe five extreme hydrologic events were discussed which ...

Five open source free hydrologic models that you can use to model runoff of micro to macro watersheds

The principal objective of hydrologic models is to forecast the runoff of a surface water body, especially dendritic systems like rivers, streams, etc. The inputs to these models are generally Rainfall/Precipitation, Soil Characteristics, and other Climatic parameters like evapotranspiration, humidity, etc. LULC and geo-morphology are also used as the required input parameters of the hydrologic models. Both input and output of these models are temporally as well as spatially variable. Now the resolution varies with different models. Some models consider all the sub-basins to be a single watershed and determine the output based on the characteristics of this single watershed(lumped).In contrast, some other models will consider the {impact|effect} of each of the sub-basins on the central outflow of the watershed(distributed).In a few models, the entire watershed is divided into grids or units of uniform dimension. However, the accuracy is highest for the models, which considers the {impa...